Appliance Monitoring with Server-Eye
Server-Eye is a monitoring solution to inspect various it components.
This document describes the REDDOXX Appliance monitoring.
Server-Eye provides 3 REDDOXX sensors:
- A sensor to check mail round trip to make sure that the appliance can correctly send and receive mails
- A sensor to check the appliance status that covers all enabled diagnoses
- A sensor to check system state (e.g. cpu load, ram, storage) via SNMP
Sensors are configured in the webinterface:https://occ.server-eye.de/.
Prior to editing sensors, the server eye client has to be installed in the local network.
When installing the server eye client, a so called connector will be created.
This connector will have the name of the computer where it was installed.
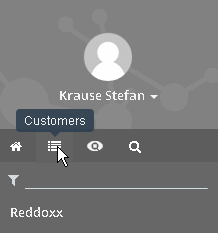
- In the server eye webinterface, select the customer that has installed the connector.
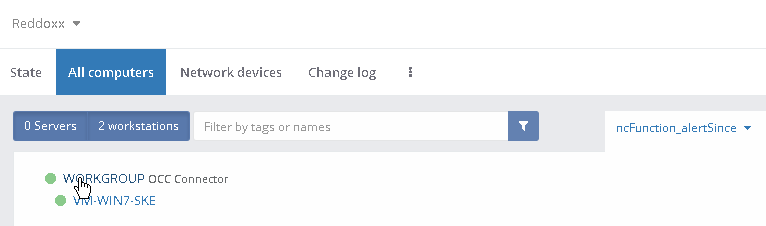
- Now select the connector
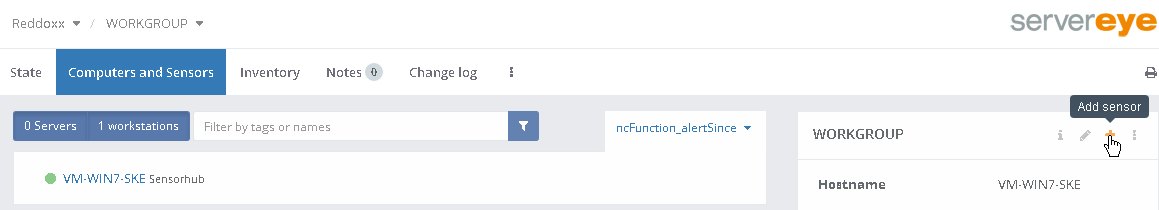
- Click the "Add sensor" button
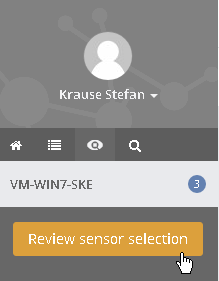
- Search for REDDOXX sensors and "pin" all three available sensors
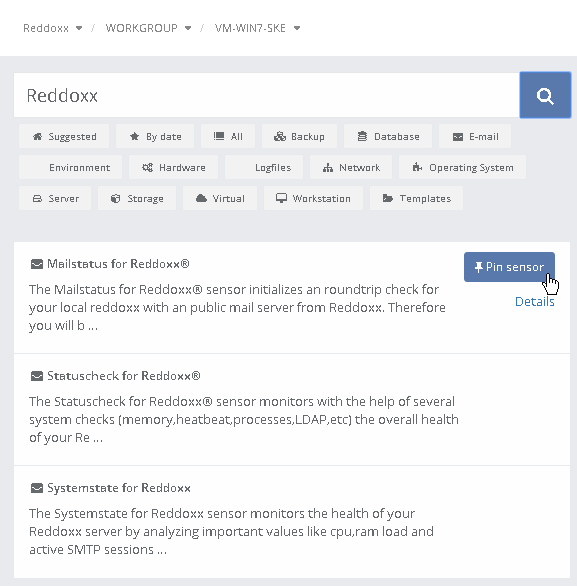
- In the left panel view, review the sensor selection
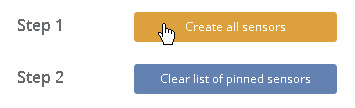
- Create all sensors
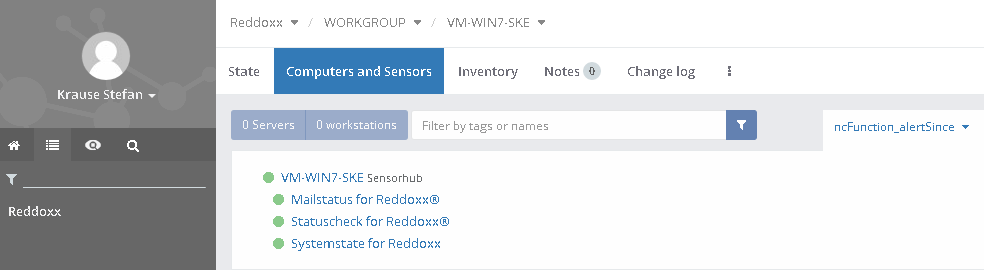
7.Switch to the connector again to configure the attached sensors

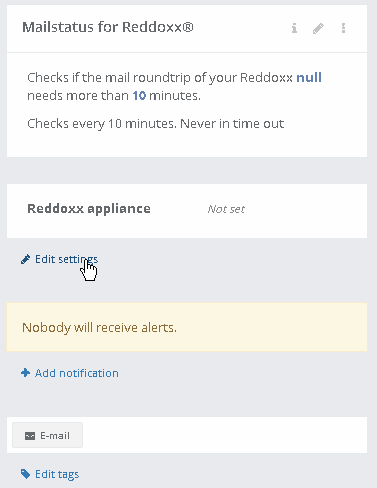
- Select each sensor and configure the sensors with "Edit settings" by providing the Appliance IP / Hostname
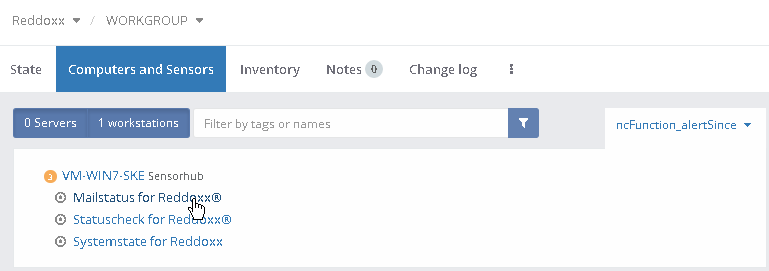
- When all sensors are configured, the first check is already done and the result is shown in the connector overview
Additionally, you can edit the sensors like before and adjust the check intervall and reporting settings when an alarm is triggered
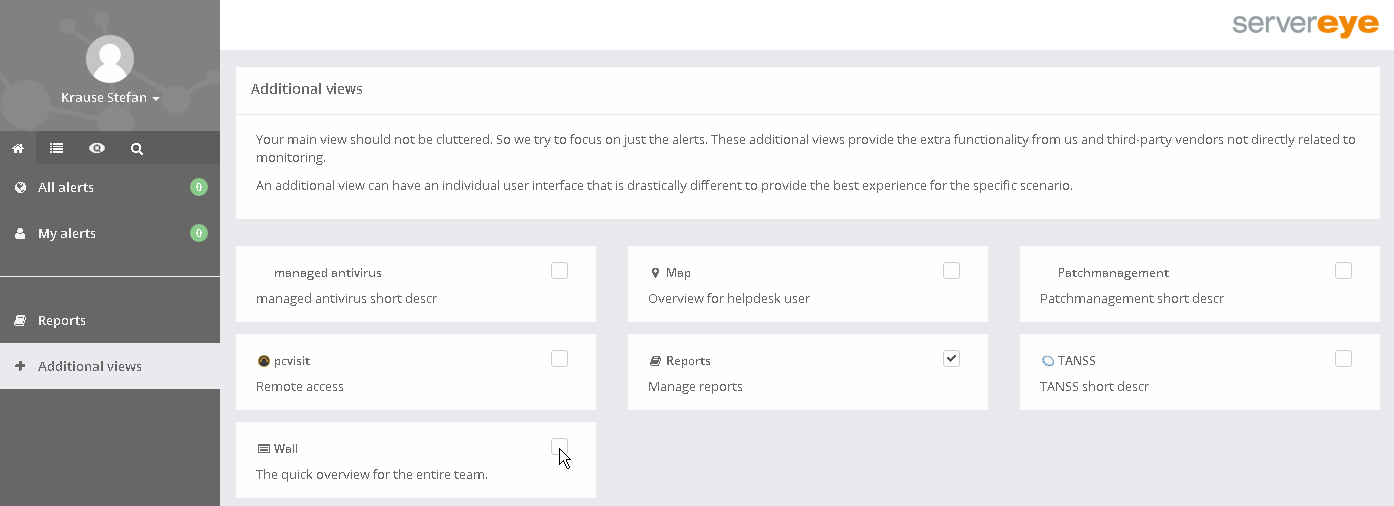
Switch to the left panel view Home and click the "Additional views" Button.
Here you can add additional views (e.g. the live WALL) to better monitor the REDDOXX Appliance status and Events.
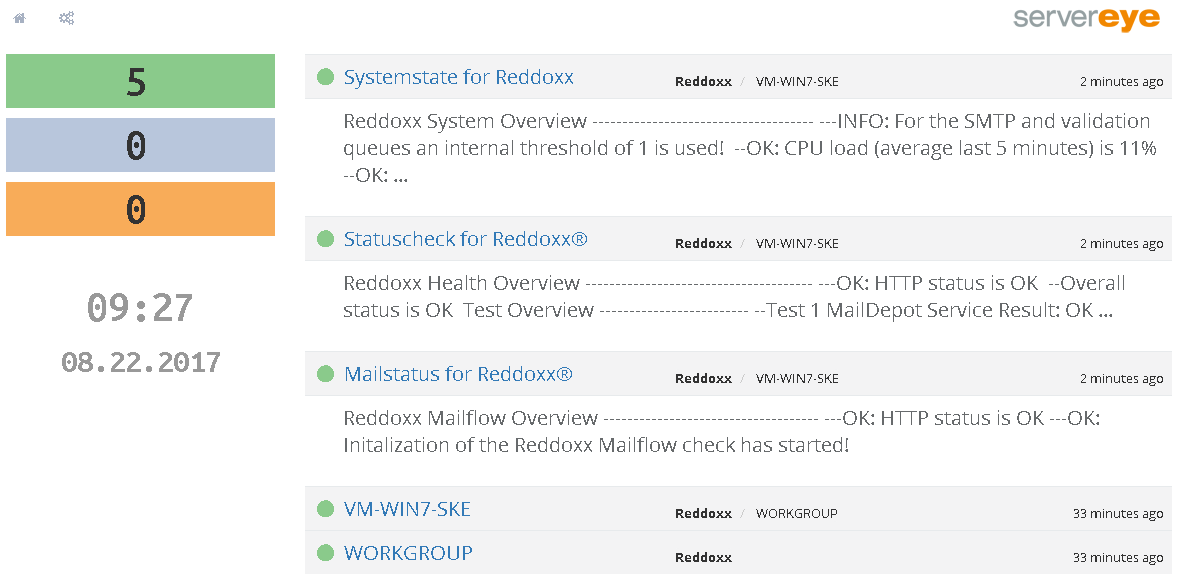
If one sensor reports an error (this is shown with an orange color), a further check in the appliance diagnose center is required.
When errors are reported for the Statuscheck (Statusüberprüfung), check the health status diagnose first.
Then run the diagnose that is reported with warning or error.
When pressing F1 in the respective diagnose, additional information as well as possible errors and solutions are displayed
When errors are reported for the System state (Systemstatus), the load (e.g. RAM, CPU, Storage, Validations) is high.
Check if the appliance is under high load (e.g. Spam Attack), or if disc space is running out, or if the storage is not available at all
When errors are reported for the Mail Check (Mailüberprüfung), the appliance can not receive or send mail within the 10 minute timeout.
This can be checked in the appliance live log (mails are send to roundtrip@monitor.reddoxx.net), if these mails get delivered correctly,
then the problem might be a wrong configured appliance address that is not reachable or there is a problem located in the network (e.g. your firewall)